My task for this week’s assignment is to create a goal on my User Science Journal that can be tracked in Google Analytics.
Goals in Google Analytics
There are two types of goals: business goals and Google Analytics Goals. Business goals are actions that the web developer wants a user to take on their website. Each time a user completes a business goal, that is called a “conversion.” This could be as simple as signing up for a newsletter or buying a product, but in Google Analytics, there is a feature called “Goals” to track these conversions. After the web developer configures Goals, Analytics will create conversion-related metrics such as total number of conversions, as well as percentage of users that converted. This is referred to as the “conversion rate.”
After a goal is set up in Google Analytics, the web developer can set up a “goal funnel.” This is a data visualization of the different steps needed to complete the goal. This visual helps developers identify where users are dropping out of the conversion process. This is particularly important for Ecommerce businesses such as Amazon or any retailer that has an online presence.
My Goals
My goal this week is to create both a destination goal and Event goal. I would like my users to visit my new Post from this week and hopefully write a compelling enough blog post that they will be curious to click the link to the article referenced above.
To help my users complete my goal, I provided a hyperlink to two articles I found on popsci.com that shows a few data analyses taken from individuals who used Google Maps during the week of Thanksgiving 2017 and Thanksgiving 2016. The trends that are highlighted in the article are broken down into three categories: Google Maps Search Trends, Popular Visit Times (destinations such as cinema, grocery store, shopping center, etc…), and Traffic Patterns.
To preview the data that highlights the habits of most people during the week of Thanksgiving, I recommend you click the link below and read for yourself! Notice if anything changed for your state or major city!
2017 Thanksgiving Google Maps Data 2016 Thanksgiving Google Maps DataSetting up Goals in Analytics and Funnels
I followed Luke Ware’s instructional video to set up the WordPress GA Event’s Plugin. I embedded the links to the two articles that I provided the user to read. I added in specific id to each element such as thanksgiving-2017 click to the article that has Thanksgiving 2017 trends and data then lastly thanksgiving-2016 click to the article that shows Thanksgiving 2016 data and trends. At this point, I went into the Google Analytics Scroll Events Plugin for WordPress and added each id above as a specific event for click tracking.
I attempted to create a funnel for each goal above by following the steps in the Google Analytics documentation How to set up Goals in Google Analytics and attempted to replicate the section that describes how to set up Goal Funnel.
- Select the Admin section in the left hand navigation bar.
- Under "Views," click "Goals"
- Select "New Goal"
- Fill out required information and select destination under type.
- Flip the funnel switch to "on" to add funnel steps.
- Each funnel step represents an action that needs to be taken to complete the goal.
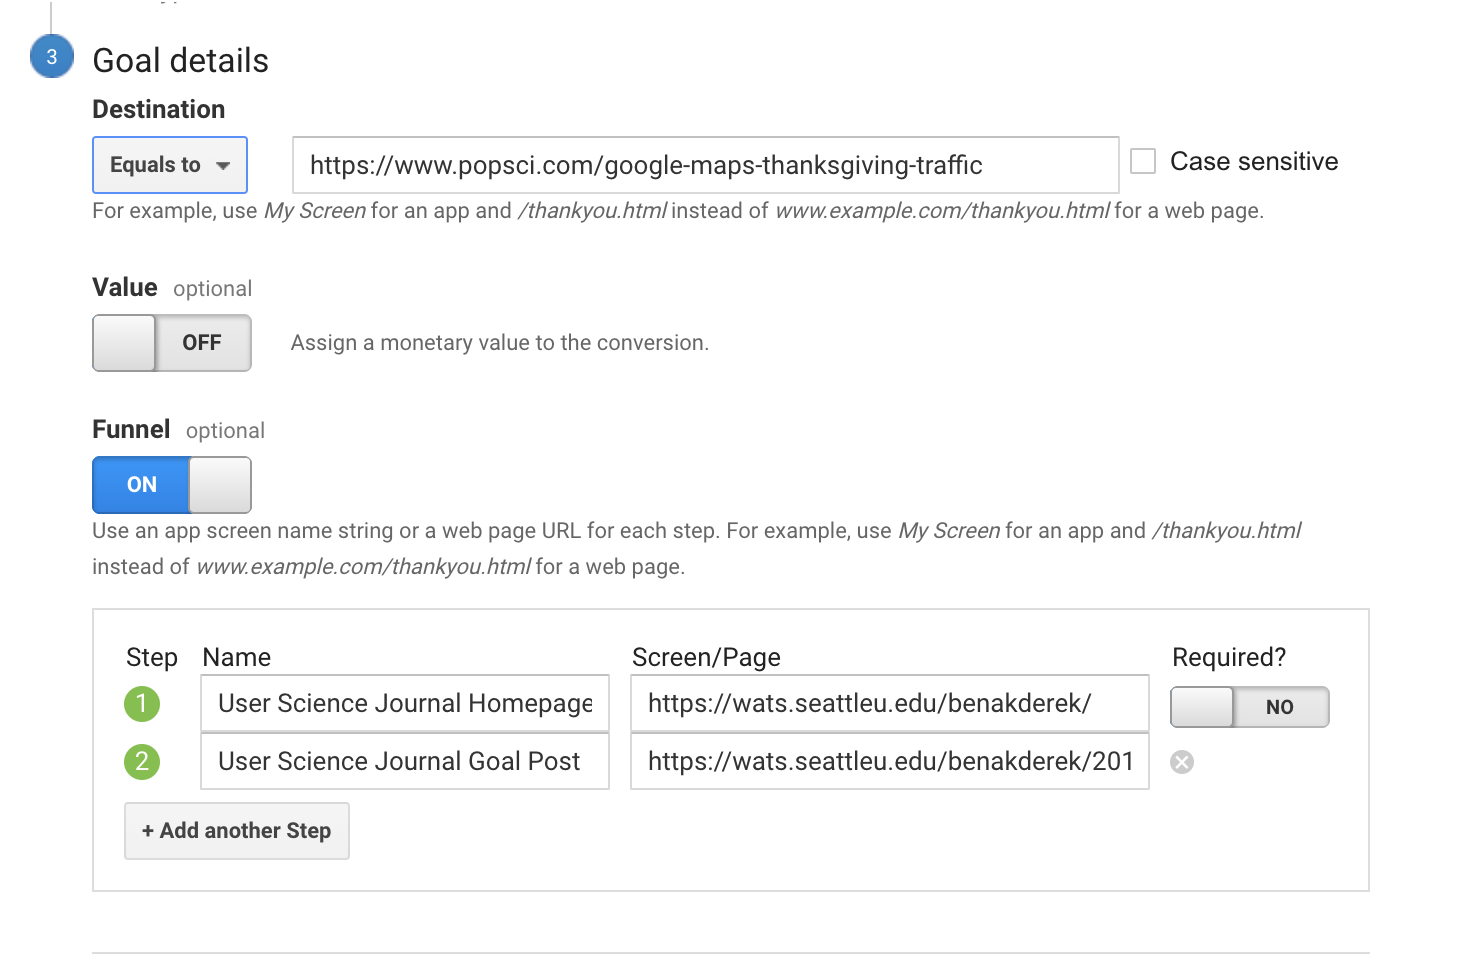 The Funnel steps for 2017 thanksgiving click goal
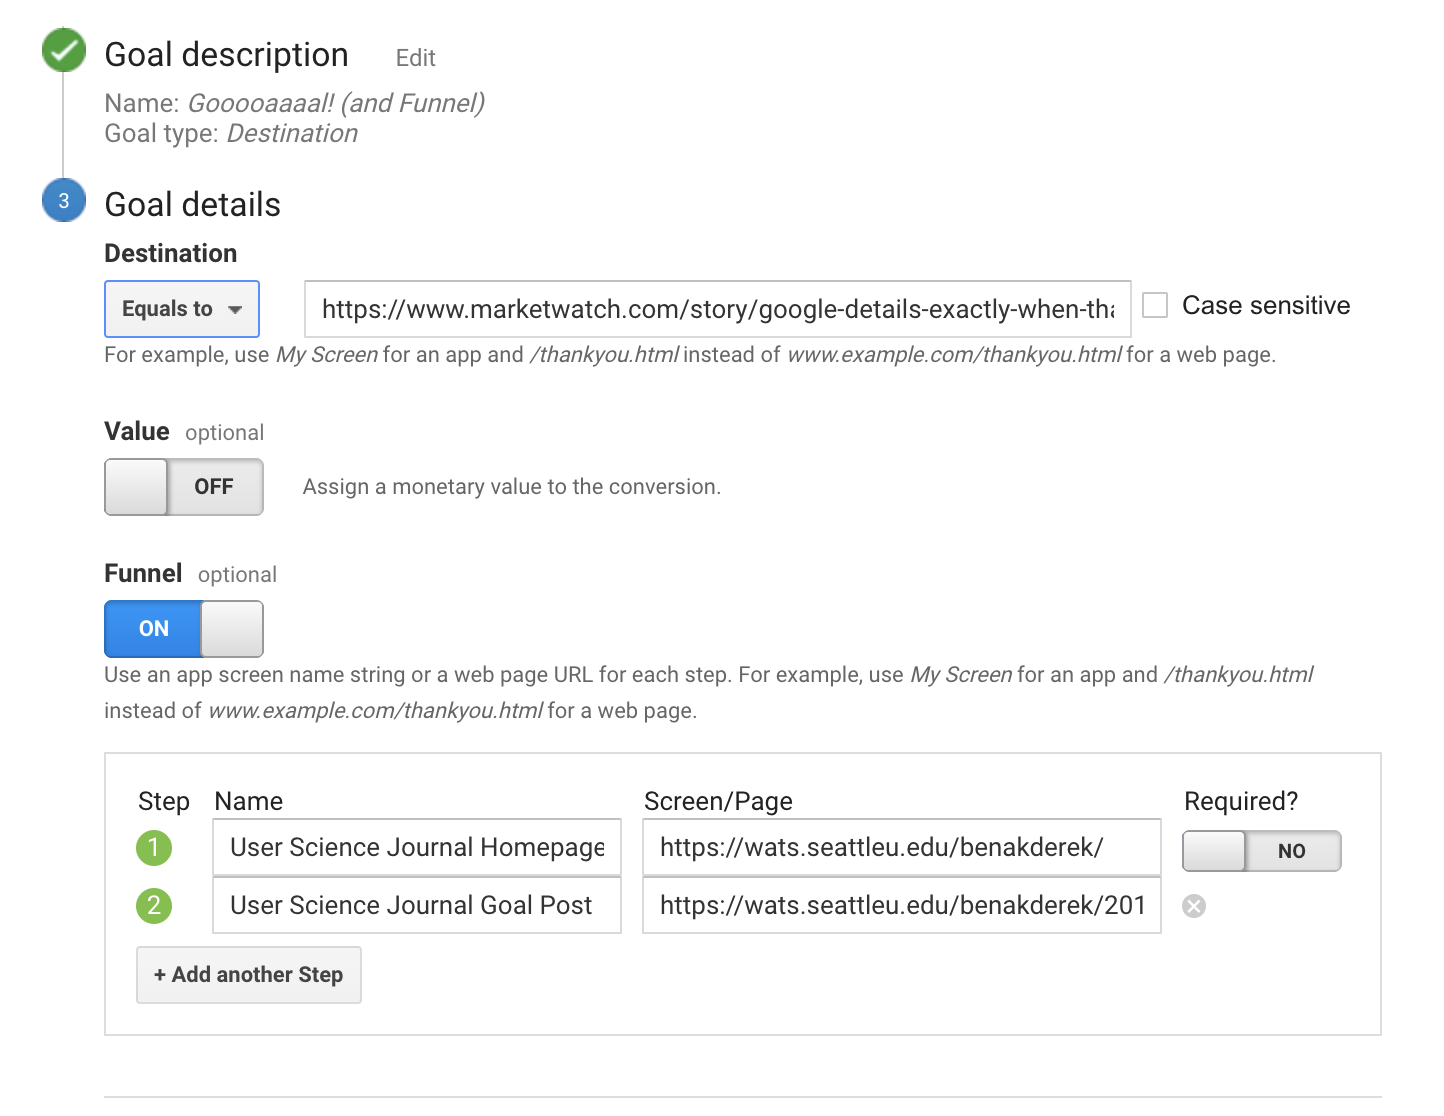 The Funnel steps for 2016 thanksgiving click goal